Cipher Hijinks (Sep 2023 - Nov 2023)
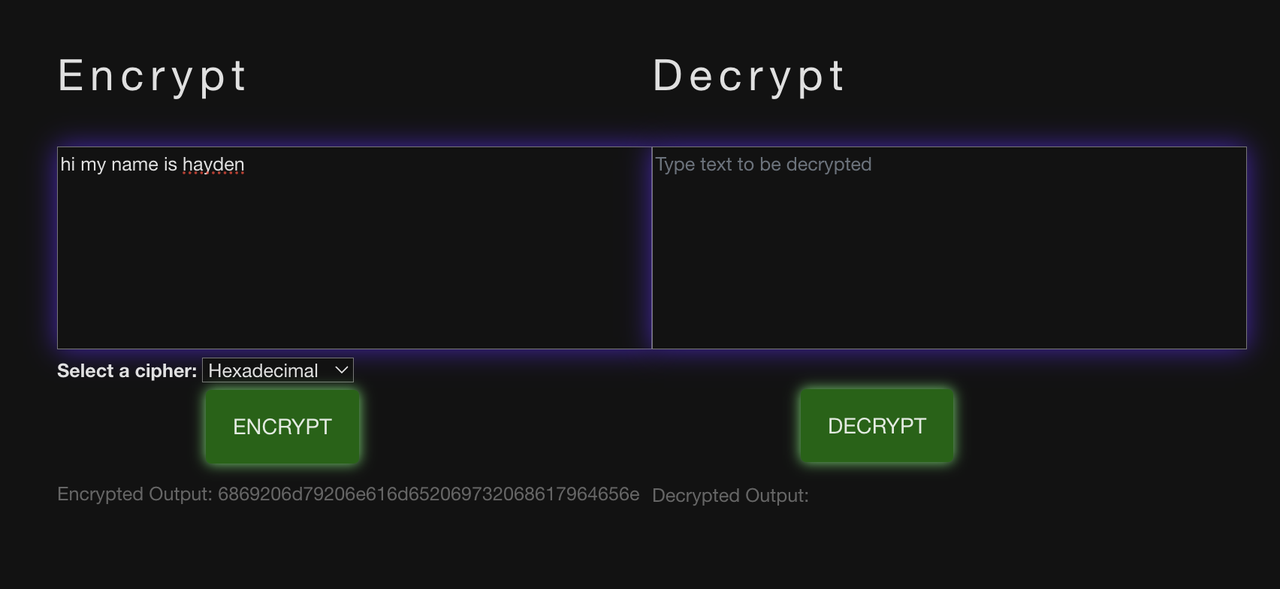
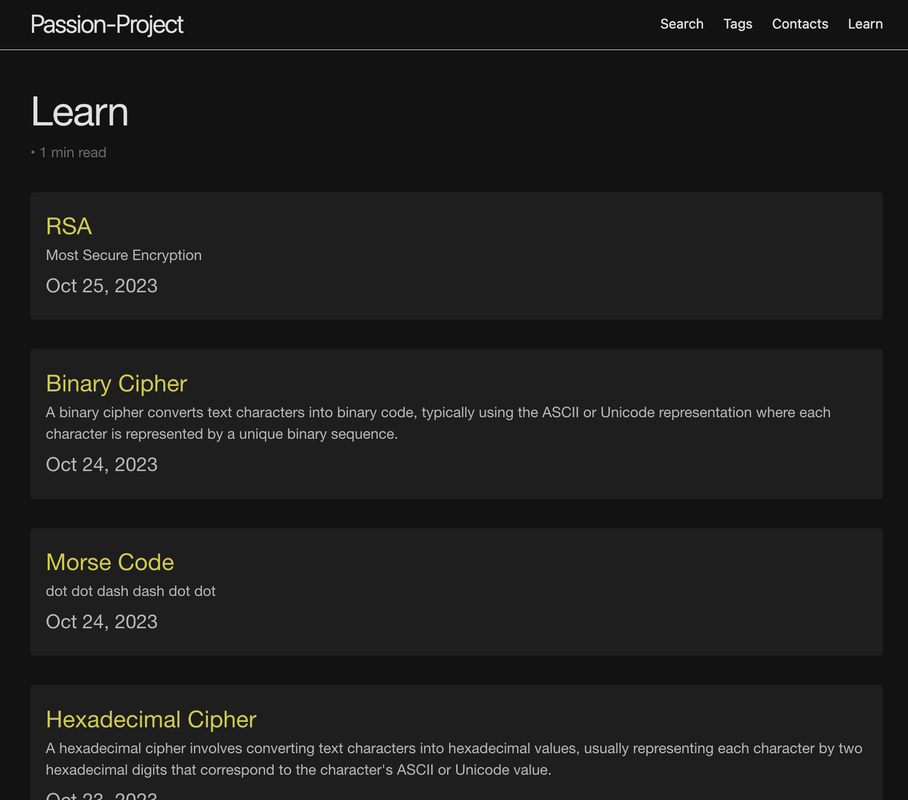
Developed a project aiming to expose different ciphers and encryption methods for text strings to people who have had little to no experience with cryptography using Jupyter Notebooks and HTML for the frontend and a Flask server backend.
Role: Frontend developer
Technologies: Flask API, HTML, JavaScript, Python
Links:
- https://github.com/monke7769/passion
- https://github.com/monke7769/passion-backend
Video demo link: https://drive.google.com/file/d/1NYka36e1u7yyegeI5gf1PnBmYa9oiy7u/view?usp=sharing
Billboard Top 100 Web Scraper (Nov 2023)
Developed an efficient Python language web-scraper to collect Billboard Top 100 songs from the official website and format into HTML table. Quicker than accessing real site and avoids advertisements that clutter up page.
Role: Sole developer
Technologies: Python, BeautifulSoup, HTML
Links:
- https://github.com/monke7769/webscraper
Video demo link: https://drive.google.com/file/d/16bubtDuW2z1IF6z7obz09T79YDCPF9Ud/view?usp=sharing
Code snippets
Python code to scrape the data from the website
import sys
import re
from bs4 import BeautifulSoup
from urllib.request import urlopen

# Redirect standard output to a file named 'data.csv'
sys.stdout = open('data.csv', 'w')

# Open a connection to the Billboard Hot 100 chart webpage
ureq = urlopen('https://www.billboard.com/charts/hot-100/')
html_content = ureq.read()
ureq.close()

# Parse the HTML content using BeautifulSoup
soup = BeautifulSoup(html_content, 'html.parser')

# Find the HTML element containing the chart results
s = soup.find('div', class_='chart-results-list')

# Find all the song names within the chart results
songnames = s.find_all('h3', id='title-of-a-story')

# Initialize lists to store song information
songs = []  # List to store song names
artists = []  # List to store artist names
lastwk = []  # List to store last week's positions
peakpos = []  # List to store peak positions
wksonchart = []  # List to store weeks on chart

# Extract song names from the songnames list
for i in range(2, 400, 4):
    name = songnames[i].get_text()
    songs.append(name.strip())

# Find all the spans with class containing 'c-label'
spans = s.find_all('span', class_=re.compile('c-label'))

# Initialize a list to store span text
spanlist = []

# Extract span text, removing unnecessary bad NEW entries
for i in range(0, len(spans)):
    badcontaining = spans[i].get_text()
    spanlist.append(badcontaining.strip())

spanlist = [i for i in spanlist if i != 'NEW']

# Split spanlist into different lists for each type of information
artists = [spanlist[i] for i in range(1, 794, 8)]  # List of artists
lastwk = [spanlist[i] for i in range(2, 795, 8)]  # List of last week's positions
peakpos = [spanlist[i] for i in range(3, 796, 8)]  # List of peak positions
wksonchart = [spanlist[i] for i in range(4, 798, 8)]  # List of weeks on chart

# Print the song information in CSV format
for i in range(100):
    print(str(i + 1) + '`' + songs[i] + '`' + artists[i] + '`' + lastwk[i] + '`' + peakpos[i] + '`' + wksonchart[i])
# use '`' as the delimiter since some songname/artist fields may contain comma
Python code to build the table
import sys
import csv

# Read data from the 'data.csv' file and store it in the 'lines' list
lines = []
with open('data.csv') as file_e:
    reader_obj = csv.reader(file_e, delimiter='`')
    for row in reader_obj:
        lines.append(row)

# Initialize the 'strTable' variable with HTML and external dependencies
strTable = '<head><link rel="stylesheet" type="text/css" href="https://cdn.datatables.net/1.13.4/css/jquery.dataTables.min.css"><script type="text/javascript" language="javascript" src="https://code.jquery.com/jquery-3.6.0.min.js"></script><script>var define = null;</script><script type="text/javascript" language="javascript" src="https://cdn.datatables.net/1.13.4/js/jquery.dataTables.min.js"></script></head><body><h1><center>Billboard Hot 100 Webscrape (Last Updated September 9 2023)</center></h1><table id="demo" class="table"><thead><tr><th>#</th><th>Song</th><th>Artist(s)</th><th>Position Last Week</th><th>Peak Position</th><th>Weeks on Chart</th></tr></thead><tbody>'

'''
this long string above does several operations.

<link rel="stylesheet" type="text/css" href="https://cdn.datatables.net/1.13.4/css/jquery.dataTables.min.css">
this imports the CSS file from datatables CDN and styles it to have the look of a Data Table.

<script type="text/javascript" language="javascript" src="https://code.jquery.com/jquery-3.6.0.min.js"></script>
the script tag imports the jQuery library, which is necessary for the DataTables plugin to work.

<script type="text/javascript" language="javascript" src="https://cdn.datatables.net/1.13.4/js/jquery.dataTables.min.js"></script>
similar to the first part, this imports the JS from the the datatables CDN. it enables the dynamic properties of the table (searching, sorting, pagination)

the rest of the long string sets up the table itself (including the tags for the table headers)
'''

# Iterate through the 'lines' list and append HTML table rows
for i in lines:
    nextstr = '<tr><td>'+i[0]+'</td><td>'+i[1]+'</td><td>'+i[2]+'</td><td>'+i[3]+'</td><td>'+i[4]+'</td><td>'+i[5]+'</td></tr>'
    strTable += nextstr

# Finalize the HTML structure with a script to initialize DataTables
strTable = strTable + '</tbody></table></body><script>$("#demo").DataTable();</script>'

# Redirect standard output to a file named 'top100table.html'
sys.stdout = open('top100table.html','w')

# Print the generated HTML table to the output file
print(strTable)
Binary.crypt (Dec 2023 - Jan 2023)
Took part in the development of an binary exposition project. Project involved visual representations of binary operations including image encryption/decryption, steganography, and colors (RGB).
Role: Frontend developer
Technologies used: JavaScript, HTML
Links:
- https://github.com/iwu78/binary
Exposition video link: https://drive.google.com/file/d/1ghLJigFjx0HCcfbWqNPND6knnyCCXCrg/view?usp=sharing
(go to 1:48-2:30, short demo)
Algorithmic code link: https://github.com/iwu78/binary/blob/main/_posts/2023-11-18-binarycolors.md?plain=1
Buttonify (Jan 2024 - Feb 2024)
Developed a button designer website where users can design and search for buttons. Features interactive button customizer UI with animations and search feature cataloging public and private designs. Utilizes SQLite database for user profile information and saved designs.
Role: Frontend developer, Database management
Technologies used: SQLite, Flask API, Python, JavaScript, HTML
Links:
- https://github.com/iwu78/CPT
- https://github.com/tarunja1ks/CPTProjectTri2Backend
Short Demo video link (0:50): https://drive.google.com/file/d/1DXWipy8yZbgi9U6lkNfiC35RPmd1y-fJ/view?usp=sharing
Code link: https://github.com/iwu78/CPT/blob/main/search.html
This code section that I wrote demonstrates my ability to use FETCH requests to backend URL requests that return the SQLite Database in JSON format. There are two functions, getPublic and getPrivate that are called based on which button the user presses (to the right of the search bar). The code then formats the data for the returned designs into the HTML table and filters based on the search keyword.
MLConcussions (Mar 2024 - May 2024)
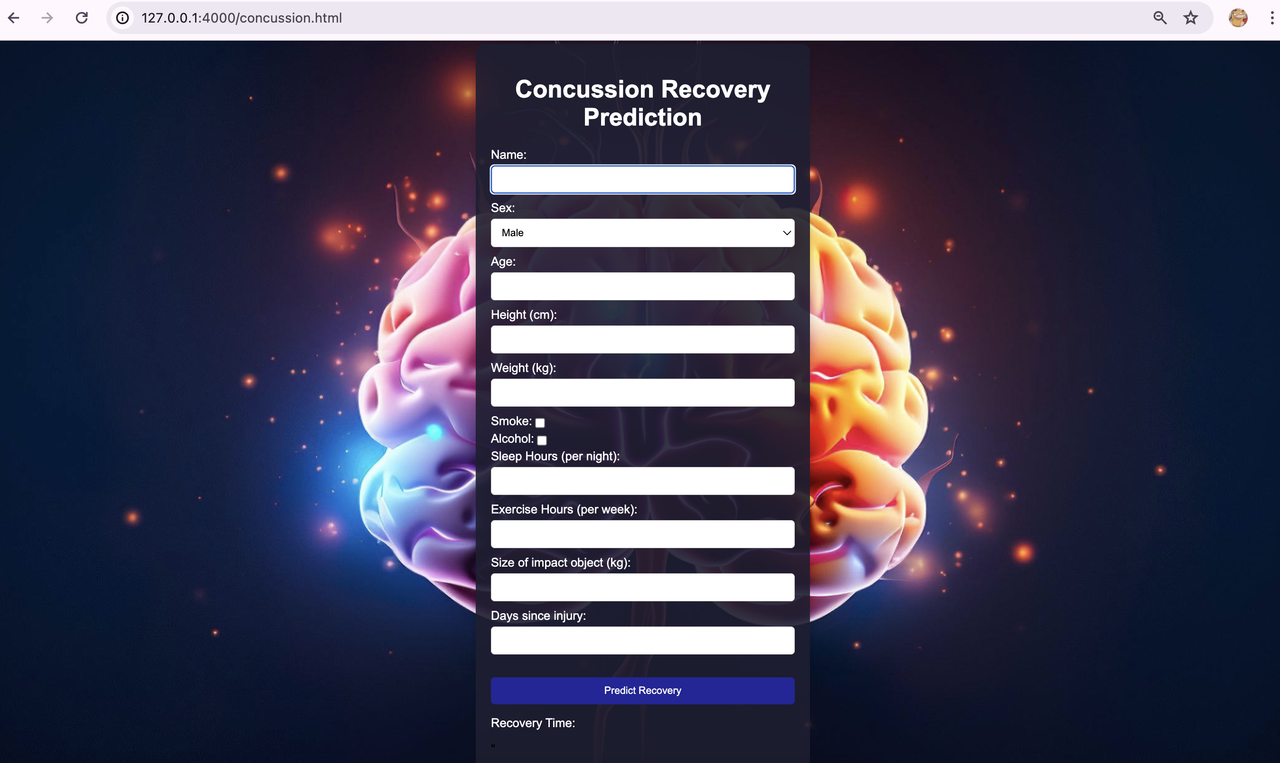
Developed a concussion website where users afflicted with concussions can get predictions on how long it will take to regain their health as well as suggestions for best recovery methods. Website takes into account users’ physical conditions and symptom severities.
Role: Backend developer, Lead Machine Learning Developer, Scrum Master
Technologies used: Linear Regression, Pandas, Python, JavaScript, HTML, Flask API
Links:
- https://github.com/monke7769/MLConcussions
- https://github.com/monke7769/MLConcussionsBackend
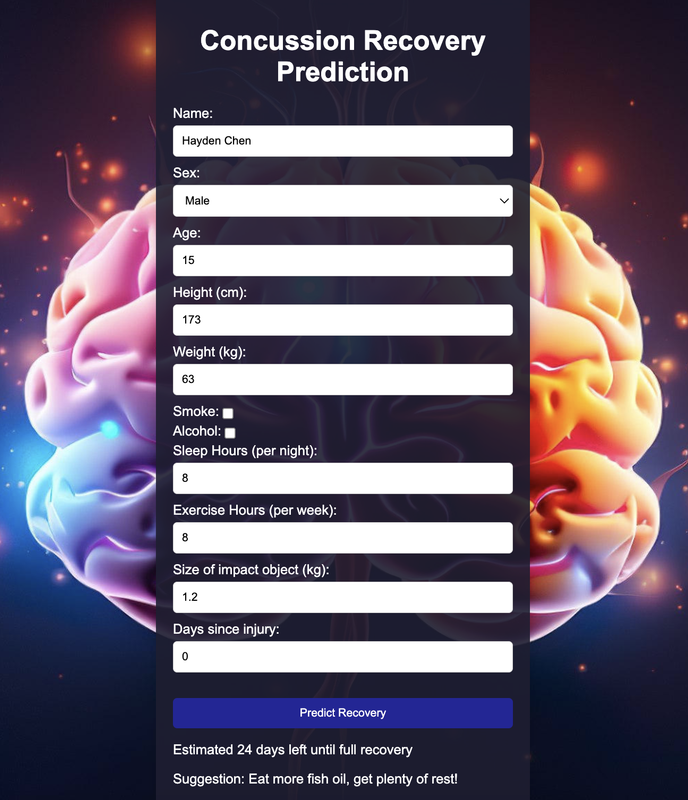
This project demonstrates my skills with Machine Learning and Linear Regression on concussion data in a CSV file. It also shows my proficiency with Python data structures and manipulation of items with the lists/dictionaries. I was able to use Pandas data frames and the Scikit-learn module to predict how much time a user would have to take to recover from their head injury based on their physical features, negative habits, and concussion impact weight. Machine Learning is done here in addition to Frontend/Backend communication (as the model is trained on the backend with Python programs and a CSV file with the data).
Screenshot of Training test data
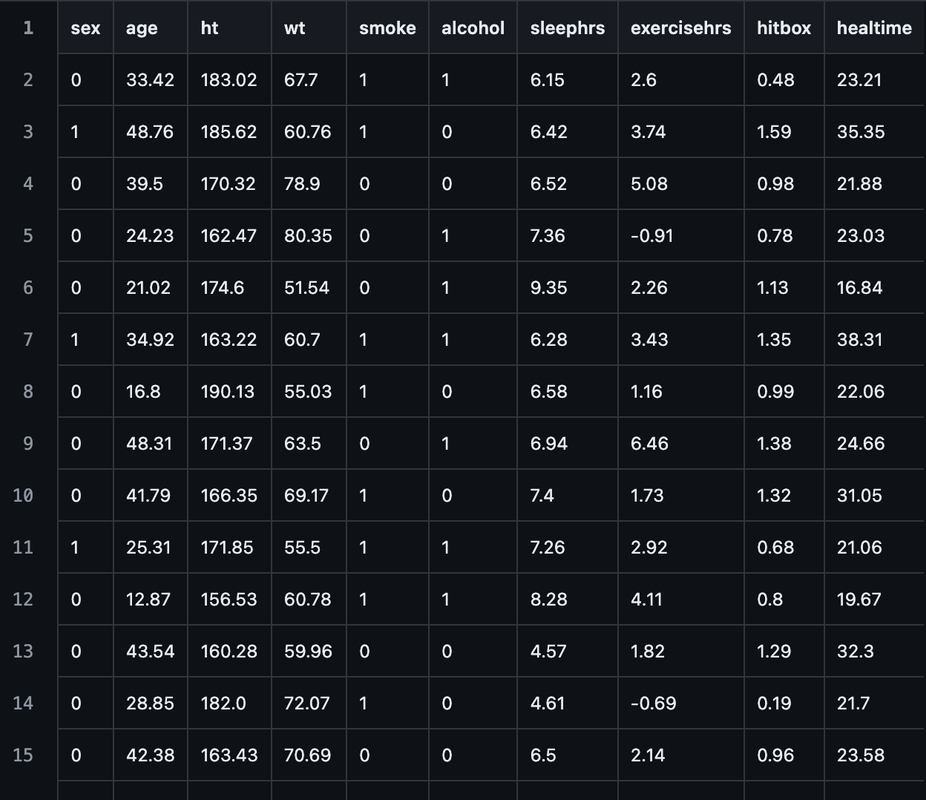
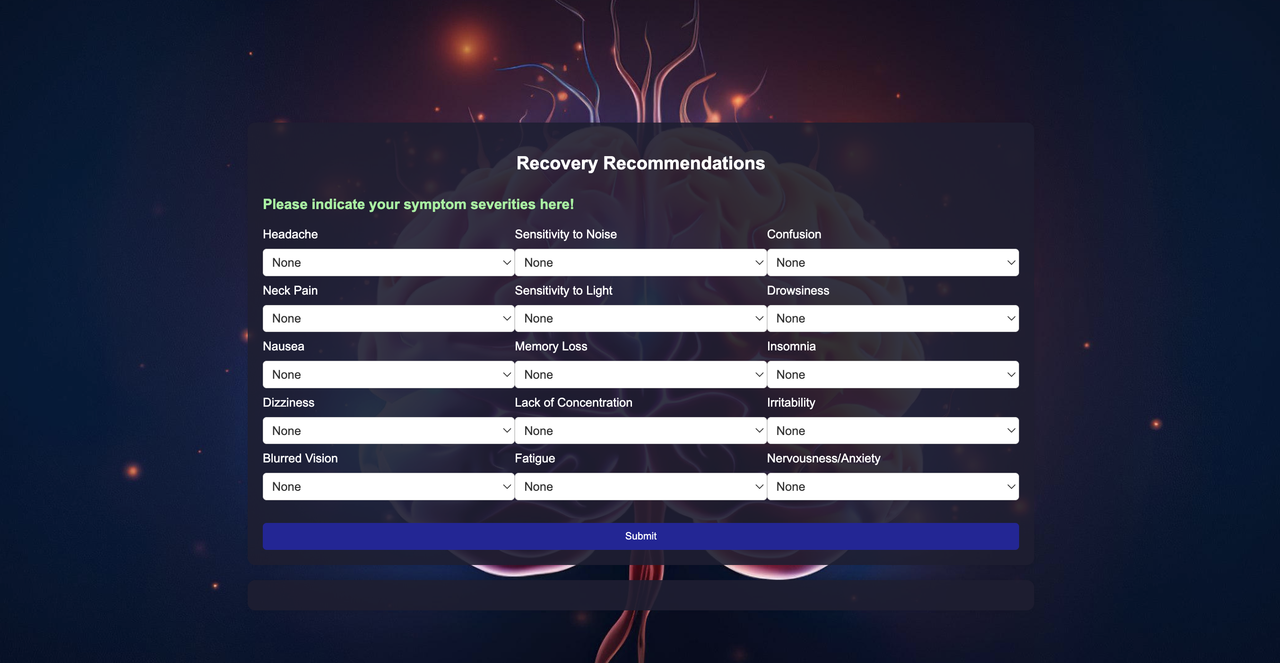
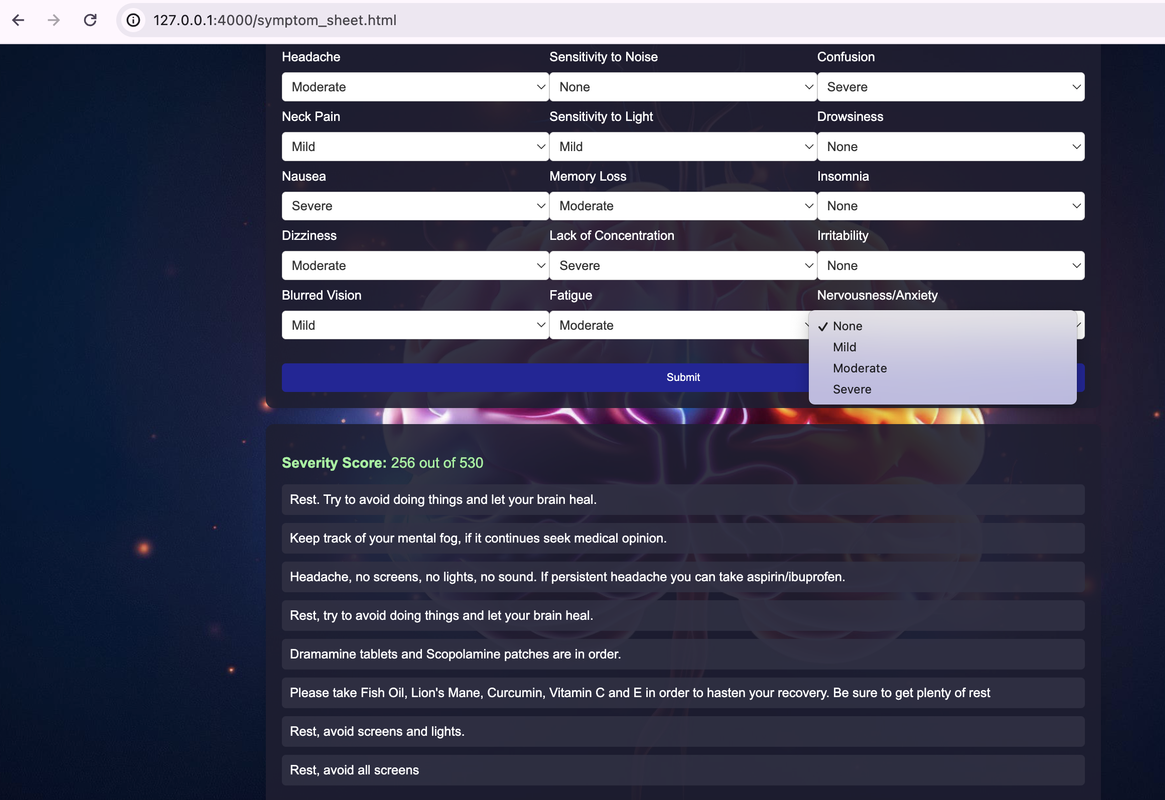
The project also has another feature that gives suggestions from doctors’ recommendations (from my partner’s personal experience) based on user-indicated symptom severities. Weights are given to these symptoms, multiplied by factors for none, mild, moderate, and severe factors and a final severity score is calculated. Suggested recovery methods are returned in JSON format after looping through the symptom list in the backend and checking the defined dictionaries for suggested recovery methods.
Code link: https://github.com/monke7769/MLConcussionsBackend/tree/main/model
- Machine Learning code: concussion.py
- Machine Learning data: concussion_recovery_data.csv (in the parent folder)
- Symptom Suggestion code: recovery.py
OpenWindows Project (Apr 2024 - May 2024)
Took part in the development of a cumulative project with the theme of a Windows 11 box. Over 10 fun sub-applications included for users to experiment with. Features machine learning (Linear Regression, NLP), extensive HTML and JavaScript, and Steganography.
Role: Backend developer
Technologies used: Linear Regression, Pandas, Python, Keras, JavaScript, HTML, Flask API
Links:
- https://github.com/iwu78/PBL_Frontend
- https://github.com/iwu78/PBL_Backend
This was a combined project themed around a Windows 11 homescreen with different applications. I worked on the Concussion Recovery ML prediction application and the Symptom/Suggestion feature (from the MLConcussion project). I also helped build/train the initial Titanic model to predict simulated user survival chances.